Introduction to Sound
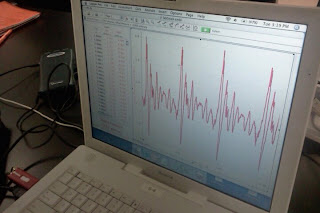
This lab used a LoggerPro software, complemented by a microphone.
Procedure:
Questions:
1.
a. Would this be a periodic wave? Support answer with characteristics.
Yes. It shows a repeated pattern - hence the word periodic
b. How many waves are shown?
Four. There are four distinct wave crests.
c. Relate how long the probe collected data to something in everyday experience (?)
It would be analogous to having a 1-second-long speech.
d. What is the period of these waves?
t_0 = 0 s,
t_f = 0.03s +/- 0.005
Δt = 0.03s +/- 0.005
Since there are 4 waves, period, T, is 0.03s / 4 waves = 0.0073 s. One wave takes 0.0073 s to complete.
e. What is the frequency?
f = T-1
f = 133.3 waves / s
f. Calculate wavelength, assuming speed of sound to be 340 m/s
λf = v
λ = v/f, whereas v = 340;
λ = 2.57 m
g. What is the amplitude of these waves?
Arbitrary. There are no specific designated comparison for the amplitude upon recording the sound. The "height" / amplitude shown has no designated quantity unit.
h. What would be different about the graph if the sample were 10 times as long?
It depends on the time. If there were 10 waves instead of 4 in 0.03 s, then the Period would decrease, frequency would increase, and wavelength would decrease. If the time changes proportionally, then there would not be any difference. The former could happen usually when someone else speaks differently to the mic. Do wavelength vary depending on how it's being spoken?
2. Have someone else to say "AAAAA..." Compare.
There were 3.75 +/- 0.25 waves in 0.03s +/- 0.005. Less wave than previous person's data.
T = 0.008 s/ wave
f = 125 waves
λ = 2.72 m
3. Collect data from the tuning fork. Compare it with the one made by human voice:
fork vs man:
Fork
VS
Man
4. If the same tuning fork was used to collect data for a sound that is not as loud, what would be different from the graph?
The amplitude would vary depending on the sound "loudness" / intensity.
Error Analysis:
There is no significant error analysis in this lab. The only possible error for this lab was the sound recording; an ideal mic would capture the sound wave function perfectly, whereas real mic would be somewhat imperfect. The graphs then, is not the entire wave function. There must have been bits missing. There is no way (at least with the present equipment) to find out the "actual" sound wave function graph, unless a "better"/ perfect, idealized mic was used, which was not possible.


No comments:
Post a Comment