Friday, April 6, 2012

Experiment 6

Exp 6
Speed of Sound

Purpose: To use fundamental frequency and spinning slinky to determine the speed of sound


Material:
Long, hollow, red plastic tube with one end closed
LoggerPro software
Measuring stick

Procedure:
Have the plastic tube spinning forming a circle. Use loggerpro software to measure the angular velocity, ω. Do the experiment several times to find several calculated values for velocity. 


v =λ f
(A.)

Frequency may be obtained by recalling that
ω = 2πf, giving 

f = ω/2π 
(B.)

While wavelength, λ, can be found by assuming that the wave pattern inside the tube would be harmonic wave:

(2n+1) λ/2 = L
 (C.)

whereas n is the number of harmonics and L length of pipe.
After λ and f were found, v, the speed of sound, can be calculated and compared.


Data and Uncertainty:
Length of pipe is 0.83 +/- 0.05 m

Two trials were conducted.
Trial 1:
ω = 3859 +/- 1 rad/s
f = 614 +/- 1 s^-1
Trial 2: 
ω = 5068 +/- 1 rad/s
f = 807 +/- 1 s^-1

The harmonics were found using the speed of sound, 340 m/s.
v = λf
v/f = λ

whereas from equation (C.), λ = 2L / (2n+1).
Both n's for trial 1 and 2 are 2+/- 0 and 3+/- 0, respectively (the uncertainty was 0 because if it were to be, for example, 2 +/- 0.05 carried from length, there is no such thing as 0.05 harmonics. Harmonics' value must be in integers).
n_1 = 2
n_2 = 3
From n, λ can be solved backwards,  using 
λ = 2L / (2n+1)

Trial 1:  λ = 0.56 +/- 0.05 m
Trial 2:  λ = 0.43 +/- 0.05 m

Putting the data together:
Trial 1: f = 614 +/- 1 s^-1, λ = 0.56 +/- 0.05 m
Velocity then, using equation (A.), is 343.84 +/- 1.05 m/s

Trial 2: f = 807 +/- 1 s^-1, λ = 0.43 +/- 0.05 m
v = 347.01 +/- 1.05 m/s

Whereas speed of sound at the sea level, according to https://www.google.com/, is 340.29 m/s
Although it does not fall within uncertainty values, the values were off by within less than 2.00% error, which can be considered insignificant. It was very close to the actual speed of sound.

Error Analysis:
Some of the possible rooms for error were the measurement of the length. The pipe had to be assumed initially to have constant diameter and did not deform when swung. Being a plastic pipe, some deformity must have occurred. This would alter the sound travel a little.
Second room for error was the rounding of harmonics, n. One value obtained was less than 3 (around 2.84, but it was rounded up to three). This altered the value by almost 10%.


END OF LAB 6.


Physics 4C complimentary guitar solo live performance

Experiment 3

Exp 3
Wavelength vs frequency


The purpose of this lab was to determine the relationship of waves' period, frequency, and wavelength.

Materials:
Simply,
     A spring
     A timer
     A measuring stick

Procedure:

Some thoughts...

A spring was oscillated consistently for 5 seconds. The length of the measured string was about 1 m long. The period would be found. Meanwhile, the spring's crests was observed to count how many waves throughout the entire oscillation. From those data, velocity could also be found using this relationship:

v = λf

Data, calculations, and errors:

Time, t, was 5.0 +/- 0.1 s throughout.


The quantity of how many times waves were seen to pass through was as seen on the side:
Trial 1: 13 waves +/- 0.25
Trial 2: 11 waves +/- 0.25
Trial 3: 11 waves +/- 0.25

The error was found using partial derivatives.
T (waves, t) = waves / t.
∂T/∂waves = 1/ut
∂T/∂t = - uwaves / ut^2
uT = squareroot of the sum of squares 
Period of each trial:
uT = 3.53. Since the data for all 3 trials are the same, the period's uncertainties, uT, are all the same, 3.53.
Period, T, is #waves / time (5s)
Trial 1 = 2.6 Hz +/- 3.53
Trial 2 = 2.2 Hz +/- 3.53
Trial 3 = 2.2 Hz +/- 3.53


Frequency is the inverse of Period
f = 1/T
f(T) = 1/T
∂f/ ∂T = - 1/T^2
the error for frequency is 
Trial 1 = 0.38 s +/- 0.08
Trial 2 = 0.45 s +/- 0.08
Trial 3 = 0.45 s +/- 0.08

Velocity is the product of wavelength. There were 2.5 waves observed throughout the three trials.
Since the length was 1 m, λ = 1/2.5 = 0.4 m +/- 0.35
(0.35 was obtained by summing all the errors together: 0.25 from waves uncertainty and 0.1 from length uncertainty)

Velocity for each trial is as follows:
v (λ, f) = λ* f
The sum of the errors, 0.35 + 0.08, is 0.43

Trial 1 = 0.15 m/s +/- 0.43
Trial 2 = 0.18 m/s +/- 0.43
Trial 3 = 0.18 m/s +/- 0.43


Error analysis:
The graph has a vertical line. This is because the experiment was done on the same time, 5 second. 
It should have been done through varying time, so the graph would look linear with real slope (slope shown here is infinity). 
All of the values look very similar / the same because again, due to the same time period. 

Another source of error would be when measuring the wavelength through observation. The entire system was in dynamic; the spring was constantly moving. It was hard to measure how many waves were observed at that moment. The 2.5 waves were simply an estimation. It would have been more accurate if a photograph of the spring was taken when oscillated and the number of crests could be counted to obtain a more accurate quantity of wavelength. 


Experiment 11

Exp 11
Human Hair Measurement

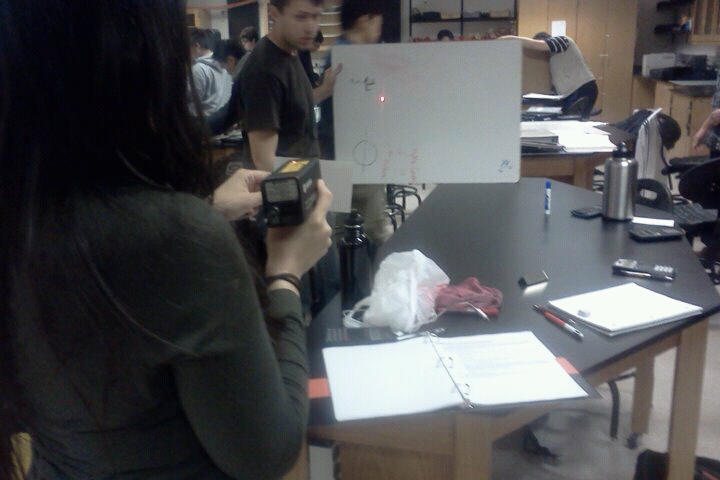
Purpose: To use the separation of light rays (interference) to rather accurately measure the thickness of human hair by measuring the distance between the reflected laser rays.


Materials/ tools:

Helium Neon Laser
Reflected Surface (whiteboard)
Taped, paper-punched-3x5 index card
Measuring Stick (LONG ruler)


Procedures:

1. Obtain a strand of human hair. Tape it across the hole of the index card.


2. Set the card parallel to the reflective surface, 1 meter apart. Set up the HeNe laser and aim it ONTO the hair strand.


3. The reflective surface would show a diffraction pattern of light. Make sure that the laser ray is orthogonal to the surface. Measure the distance of the light diffraction.


The reflected light ray (center) has trailing, fading light diffraction immediately to its left and right

Data and Uncertainties:

Variables:
L = Distance between the surface to hair strand
y = Distance between light diffraction
λ = laser's wavelength
d = hair thickness

λ = d y / L


λ = 632.8 nm = 632.8 * 10^-9 m (Since it is the standard wavelength of HeNe laser, it is assumed accurate, and has no uncertainties)


Helium Neon laser is assumed to have a fixed wavelength... whoa!


Experiment 1:
L = 1.00 +/- 0.05 m
y = 0.25 +/- 0.1 cm  = 0.0025 +/- 0.001 m (large uncertainty due to difficulty measuring closely-spaced diffraction using large measuring stick)

d = λ L / y
d = 2.53 * 10^-4 m = 2.53 * 10^-1 mm = 253 μm

Experiment 2:
L = 1.02 +/- 0.05 m
y = 0.0052 +/- 0.001 m

d = 1.24 * 10^-4 m = 124 μm

Uncertainty by partial derivatives
d(y, L) = λ L / y

∂d/ ∂L = 1/ uy
∂d/ ∂y = uL * ln (y)

ud = ((∂d / ∂L * uL)^2 + (∂d / ∂y * uy)^2 ) ^(0.5)
ud = ((1/uy * uL)^2 + (uL * ln (uy))^2) ^(0.5)

Experiment 1:
ud = ((1/ 0.001 * 0.05)^2 + (0.05 * ln(0.0025) * 0.001)^2)^0.5
ud = (2500 + 0)^0.5 
ud = 50

Experiment 1 = 254 μm +/- 50 m = 254 +/- 50000000 μm
This uncertainty value makes no sense. 2nd method of uncertainty will be used by adding up all the uncertainties:

Uncertainty by adding up all the uncertainties:
Experiment 1 and 2: uL = 0.05 m, uy = 0.001m, uλ = 0
ud = Σ_uncertainties = 0.051

Experiment 1:
d = 2.53 * 10^-4 +/- 0.051 m = 253 +/- 51000 μm
Experiment 2:
d = 124 +/- 51000 μm


The average human hair thickness ranges from 40 to 250 μm, according to http://wiki.answers.com/Q/What_is_the_average_thickness_of_a_human_hair
Our experiment yields value of about 120 and 250 μm, which falls within the expected values (although the uncertainties are rather outrageously substantial).


Error analysis:

One of the possible cause of errors is the measuring of the diffraction. Since the diffraction was spread very closely to each other and the most intense ray (middle ray) outshone the other rays, it was highly possible that there was an additional ray hidden under the brightest ray. Miscounting one ray could throw off the data by magnitudes of ten. 
Another possible error is the position of the laser and the surface. During the experiment, it was merely being approximated that they were perpendicular to each other. If they were not truly perpendicular, then the distance, L, was not the true value. 
Another yet possible error is the condition of hair itself. It is possible that the person whom hair was being experimented on used a thickening hair product, causing the hair to be thicker than usual. One of the person was a female, so the chances of hair thickener being used would be higher. 


END


Wednesday, April 4, 2012

Exp 10

Exp 10
Lenses


Purpose:
To observe the behavior of light through converging (convex) lenses and how magnification and height is a function of the distance of the object from the light source; to also observe when an image is inverted and upright in front of converging lens.

Materials:
1. BIG rulers (meter stick)
2. Light source (light box with distinct shape on the opening)
3. Converging (convex) lens and lens holder
4. Flat, not diffused, surface

Procedures:

Since the lenses' focal length was unknown, it had to be predetermined before the lab could continue. This can be done by facing the lens against a light source infinitely far away (to get straight light rays) and measure the distance at which the converging light rays are strongest. 


 The height and horizontal distance from the meter stick was measured, forming a triangle. The hypotenuse would be the distance of focal point (f).

The triangle was a right, 6.0 * 7.0 triangle, with hypotenuse of 9.2 cm, the focal length.


Actual lab and questions:

The lens was put on the lens holder on a meter stick, against a light source. On the other end, a smooth surface was set up to show the shape of the image and measured.

Initially, the lens was put at distance four times focal length (f), which was 36.8 cm.
d_0 = 36.8 cm
The surface was adjusted to get the sharpest image. The distance between surface and light source was 44.2 cm. The distance between surface and the lens,
d_i = 7.5 cm


The height of filament (light box/ source) is
h_0 = 9.0 cm
whereas the height of the image
h_i = 3.1 cm
Magnification, M is h_i / h_0 = 0.33, a third the of original object.
The image is real.


When the lens is reversed, the measurements were still the same.
d_0 = 36.8 cm
d_i = 7.5 cm
h_0 = 9.0 cm
h_i = 3.1 cm
M = 0.33

The lens was moved back, towards the light source, so its distance was now 2f.
d_0 = 18.4 cm
d_i = 30.2 - 18.4 = 11.8 cm
h_0 = 9.0 cm
h_i = 6.0 cm
M = 0.66
The image was still the same as the above data when the lens was reversed.

The lens was moved further back, with distance 1.5 f
d_0 = 13.8 cm
d_i = 31.0 - 13.8 = 17.2 cm
h_0 = 9.0 cm
h_i = 12.0 cm
M = 1.33
Image was the  same reversed.

When half of the lens was covered, the image was still reflected with the same shape, but dimmer.


Lab part 2.
The lens was now set up at different distances.

h_0 = 9.0 cm

5f:
d_0 = 46.0 cm, d_i = 18.6 cm, h_i = 2.2 cm, M = 0.24
Image was inverted.
4f:
d_0 = 36.8 cm, d_i = 12.3 cm, h_i = 3.1 cm, M = 0.33
Image was inverted.
3f;
d_0 = 27.7 cm, d_i = 10.0 cm, h_i = 3.4 cm, M = 0.36
Image was inverted.
2f:
d_0 = 18.4 cm, d_i = 12.0 cm, h_i = 6.0 cm, M = 0.66
1.5f:
d_0 = 13.8 cm, d_i = 17.2 cm, h_i = 12.0 cm, M = 1.33

At 0.5f (4.6 cm) however, the image appeared too large to see. But when calculated/ predicted, it should have appeared upright.
Since it was not able to be observed directly, the image was only observable if seen through the lens directly. This type of image is virtual. The image, as predicted, was no longer inverted, but upright.
graph of d_i vs d_o

The graph was supposed to be analogous to y=1/x graph, though. 


Q. 8. The y intercept can not be found, because of the hyperbolic nature of the graph. The first graph does not look like to have a y intercept, as (10,27) was the uttermost left point (vertex).

The y value represents the negative inverse of object distance; since it is negative inverse, it represents the virtual distance.

Error and analysis:
The first possible error was during the calculation of the focal point; measuring the triangle's hypotenuse (distance) was done rather loosely; it was done on the hill and not a flat surface. The triangle was no longer perfectly orthogonal anymore.
The second one was observable by looking at the graph; there seemed to be a mistake when recording either the distance or height of the image at 4f. The graph showed a point at y= 36.8 cm (4f), whereas it should have been lower: distance less than the recorded image distance. The magnification then, is somehow off. The graph has two points that were misplaced; it should look like y=k/x, whereas the graph from experiment appeared hyperbolic instead.

1/S + 1/S' = 1/f, whereas S is object distance to lens and S' is the image distance from lens to reflective surface (surface where the reflection is the sharpest).
Solving for f, the following equation was obtained:

A. f = S(S') / (S' + S)
B. M is |S'|/ S, and S' = MS
C. S = S' / M
substituting that into equation A, f = (MS) / (M+1), and substituting C into equation A, f = S' / (M+1)
Focus depends only on either M and S or M' and s.

Conversely, S = S'f / (S' - f); object distance depends on image distance and focus over difference between image distance and focus.
Lastly, using M = |S'| / S, equation M = (S' - f)/ f was obtained. Using S, M= (S-f) / (f * S^2)
Magnification here is dependent on the sum of S and negative f over f times object distance squared. If S - f < 0, meaning object is placed where it is less than focus distance, it will give negative M. The image will be magnified differently. That explains when the object is placed close (S <= 0.5 f) as done in experiment to lens, it would appear upright and magnified and when  it is placed farther than half the focal length, it would appear smaller (0 < M < 1) and inverted.

Friday, March 30, 2012

Experiment 9

Experiment #9
Concave and Convex Mirrors

Purpose
The purpose of this lab is to observe the images produced by convex and concave mirrors; to analyze the geometry behind reflected rays on the two mirrors, how each mirror magnifies in a certain way (and sometimes flips upside down); to understand the relationship between the two mirror's different curvatures, focus points, and how they would affect the object's image to appear having different height and at different distance.

Questions / guidelines


I. Convex Mirror

1. Place an object in front of the convex mirror.
A. The image appears smaller than the actual size of object.
B. The image is upright.
C. The image is located farther relative to the position of the mirror and object.

2. Move the object closer.
The object grows in size / appears bigger as it gets closer. It also appears to more bent/ curved.

3. Move object further.
The object grows smaller and less bent.


Diagram of Convex Mirror


II. Concave Mirror
1. Place an object in front of mirror


A. The image appears larger than the object.
B. The image appears inverted when it's located behind (away) from the curvature point. When the object is close, the image would appear upright.
C. The image appears to be located relatively closer than actual distance of the object and mirror.


Object appears inverted

2. Move the object close.
The image grows larger in height (size), inverted. When it's close enough, the image would blur and when it's even closer, it would appear upright and magnified.

3. Move the object further.
If the object started off very close, it would appear upright and magnified; as the object is brought away, it would become smaller, then it would blur, then it would appear inverted and smaller. If the object started off not too close, it would start off appearing inverted. As it is brought away, it would grow less in size.


Concave mirror diagram


The graph at the end of Lab 9. d_0 = 10.5 +/- 0.1 cm, d_i = 3.2 +/- 0.1 cm, h_0 = 2.2 +/- 0.1 cm, h_i = 0.7 cm.

M = 0.3 +/- 0.2

Error Analysis


The magnification can be represented as

m = y' / y = - (s' / s)

whereas y' is the height of the image, and y is the height of object (actual). The s' are distances, just like height. m simply gives the ratio of y' and y and actual vs appearance distance.
The main source of error is due to the magnification of the ruler used when measuring the distance; while measuring the distance of object can be done easily by simply using a ruler, measuring the distance of image cannot be done by simply using a ruler; the ruler in the mirror is an image, a distorted image. An image of 1 cm is not 1 cm in real world.
To fix it, a detailed photograph/  still image should have been taken, and a comparison between the actual vs appearance distance can be made then by measuring the difference of distances (actual and image) from the photograph.


END.


Um, smile...? ;)

Experiment 5

Experiment 5
Introduction to Sound


The purpose of this experiment was to further analyze the function and shape of waves (sound waves) using human speech.

This lab used a LoggerPro software, complemented by a microphone.


Procedure:

An arbitrary person would start by saying "AAAAA" to the microphone to be recorded and analyzed by loggerpro. The recording time would not exceed 2-3 seconds (1 second would suffice to determine the Frequency). Loggerpro would then show the graphical representation of such sound waves.


Questions:
1.
a. Would this be a periodic wave? Support answer with characteristics.
Yes. It shows a repeated pattern - hence the word periodic

b. How many waves are shown?
Four. There are four distinct wave crests.

c. Relate how long the probe collected data to something in everyday experience (?)
It would be analogous to having a 1-second-long speech.

d. What is the period of these waves?
t_0 = 0 s,
t_f = 0.03s +/- 0.005

Δt = 0.03s +/- 0.005
Since there are 4 waves, period, T, is 0.03s / 4 waves = 0.0073 s. One wave takes 0.0073 s to complete.

e. What is the frequency?
f = T-1
f = 133.3 waves / s

f. Calculate wavelength, assuming speed of sound to be 340 m/s
λf = v
λ = v/f, whereas v = 340;
λ = 2.57 m

g. What is the amplitude of these waves?
Arbitrary. There are no specific designated comparison for the amplitude upon recording the sound. The "height" / amplitude shown has no designated quantity unit.

h. What would be different about the graph if the sample were 10 times as long?
It depends on the time. If there were 10 waves instead of 4 in 0.03 s, then the Period would decrease, frequency would increase, and wavelength would decrease. If the time changes proportionally, then there would not be any difference. The former could happen usually when someone else speaks differently to the mic. Do wavelength vary depending on how it's being spoken?

2. Have someone else to say "AAAAA..." Compare.
There were 3.75 +/- 0.25 waves in 0.03s +/- 0.005. Less wave than previous person's data. 
T = 0.008 s/ wave
f = 125 waves
λ = 2.72 m


3. Collect data from the tuning fork. Compare it with the one made by human voice:

fork vs man:

 Fork

VS

Man

4. If the same tuning fork was used to collect data for a sound that is not as loud, what would be different from the graph?
The amplitude would vary depending on the sound "loudness" / intensity. 


Error Analysis:

There is no significant error analysis in this lab. The only possible error for this lab was the sound recording; an ideal mic would capture the sound wave function perfectly, whereas real mic would be somewhat imperfect. The graphs then, is not the entire wave function. There must have been bits missing. There is no way (at least with the present equipment) to find out the "actual" sound wave function graph, unless a "better"/ perfect, idealized mic was used, which was not possible.


Thursday, March 22, 2012

The M-in-M experiment (Marshmallow in Microwave)

Lab x
Marshmallows, Photons, and Waves

The purpose of this lab is to realize Microwave Oven as a wave-generator producing standing waves, to analyze the characteristics of such wave, and how it generates certain "hot spots" when heating foods.
The second purpose of this lab is to realize that Marshmallow absorbs heat/ energy very easily (swells rapidly within seconds), thus during a nuclear warfare, wearing a marshmallow suit is highly not recommended.
The dimensions of microwaves are L : W : H = (0.36 m : 0.36 m * 0.23 m) +/- 0.001
This blog will answer few questions on a given handout, and they are listed and answered as follows:
1. Determine the frequency of the microwaves
v = λf
length, 12cm +/- 1 (0.12 m +/- 0.0012), is half λ
f = v/λ, whereas v is speed of light (3*10^8)
f = 1.25 GHz +/- 0.0012


2. Deduce the range of possible dimensions including the smallest possible microwaves


The possible dimensions would be the wavelength of the standing wave. It is 12 cm +/- 1. Assuming the microwave is emitting perfectly horizontal wave from side to side, the smallest dimension of microwave therefore is 12 cm by 12 cm by any reasonable height.


- During the experiment, a cup of 100.0 g of water is heated for 30 s, then measured the temperature difference.
Initial temp = 20.0 +/- 0.1 C, final temp = 57.5 +/- 0.1 C. ΔT is 37.5 C. +/- 0.2


3. Total energy content of water?


Energy, or heat, is expressed in Q = m c ΔT. Where c = 4.186 J/g C
Q then, is 100g * 4.186 * 37.5 = 15697.5 J +/- 0.3


*Power, P, is joules per second. The time is 30 s, therefore Power = Q/t = 523.3 W +/- 0.3


4. How many photons per second?
Energy per Photon is expressed in E = h f
frequency is 1.25 GHz +/- 0.0012, while h is planck's constant, which is 6.626068 × 10⁻³⁴ m2 kg / s


E(per photon) = h f = 6.63 * 10^-34 * 1.25 *10^9 = 8.23 * 10^(-25) J

E(total) = 15697.5 J. +/- 0.0012
# of Photon then, is E(total) / E(per photon) = 1.91*10^28 photons. +/- 0.0012

5. What pressure do these photons exert on the side of the microwaves?

I = P/A
Area of Microwaves is W * L (it's a relatively square microwave) 0.1296 m^2 +/- 0.002
Power is calculated to be 523.3 W +/- 0.3
I = 4037.8 W/m^2 +/- 0.302

p(rad), radial pressure, is I / c;
p = 1.35 * 10^(-5) N/m^2 +/- 0.302


END

Expiration date : 12/ 08/ 2008